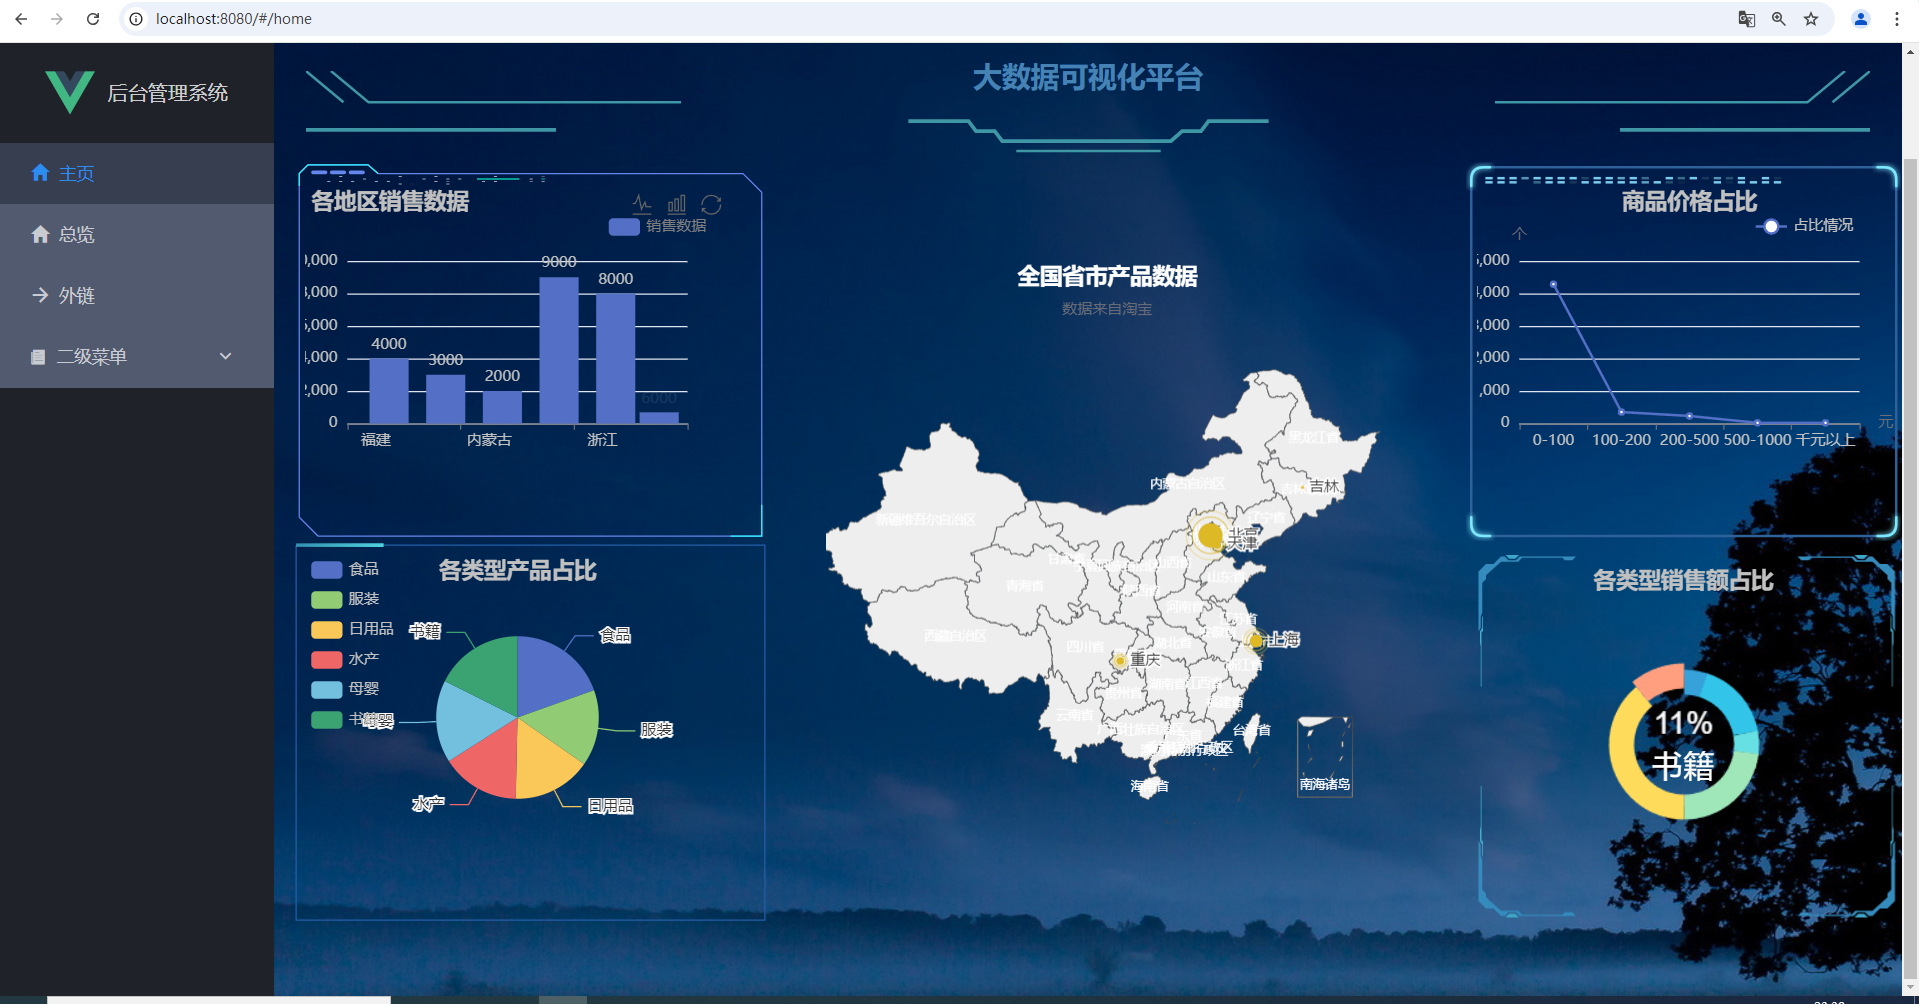
商品大数据可视化系统
前言
这是个项目是对淘宝的数据进行:数据爬取,数据分析,可视化大屏,机器学习进行销量预测。
视频:商品数据可视化大屏
技术:
数据获取:爬虫的selenium自动化技术
数据存储:MySQL数据库
后端:python的Django框架
前端:vue框架
图表:echarts
需要的工具:
后端与数据库:
- python,pycharm专业版
- MySQL,Navicat
- Chrome,ChromeDriver
前端:
2
npm config set registry https://registry.npmmirror.com
- vscode
项目展示:
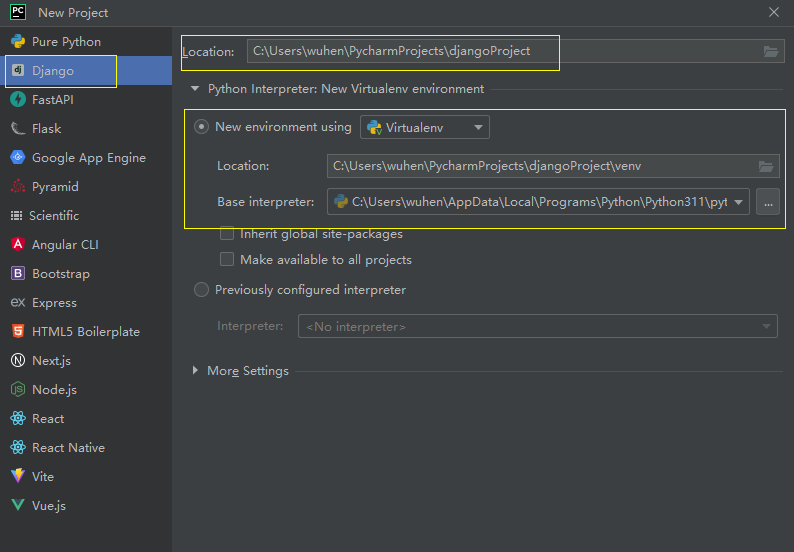
1.项目初始化
1.创建项目
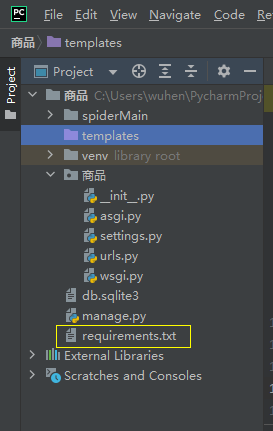
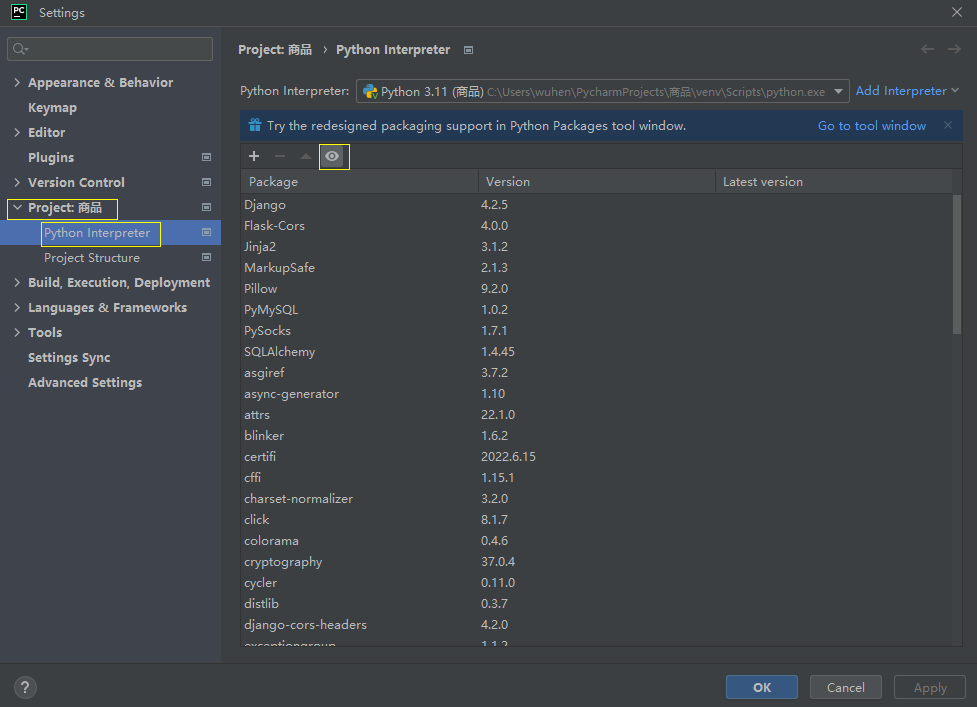
2.安装依赖
创建一个requirements.txt文件,requirements.txt的内容是:
1
2
3
4
5
6
7
8
9
10
11
12
13
14
15
16
17
18
19
20
21
22
23
24
25
26
27
28
29
30
31
32
33
34
35
36
37
38
39
40
41
42
43
44
45
46
47
48
49
50
51
52
53
54
55
56
57
58
59
60
61
62
63
64
65
66
67
68
69asgiref==3.7.2
async-generator==1.10
attrs==22.1.0
backports.zoneinfo==0.2.1
blinker==1.6.2
certifi==2022.6.15
cffi==1.15.1
charset-normalizer==3.2.0
click==8.1.7
colorama==0.4.6
cryptography==37.0.4
cycler==0.11.0
distlib==0.3.7
Django==4.2.5
django-cors-headers==4.2.0
exceptiongroup==1.1.2
filelock==3.12.2
Flask==2.3.3
Flask-Cors==4.0.0
Flask-SQLAlchemy==3.0.5
fonttools==4.34.4
greenlet==2.0.2
h11==0.13.0
idna==3.3
importlib-metadata==6.8.0
itsdangerous==2.1.2
jieba==0.42.1
Jinja2==3.1.2
joblib==1.3.2
kiwisolver==1.4.4
lxml==4.9.3
MarkupSafe==2.1.3
matplotlib==3.5.2
mysqlclient==2.2.0
numpy==1.23.1
outcome==1.2.0
packaging==21.3
pandas==1.5.3
Pillow==9.2.0
platformdirs==3.10.0
pycparser==2.21
PyMySQL==1.0.2
pyOpenSSL==22.0.0
pyparsing==3.0.9
PySocks==1.7.1
python-dateutil==2.8.2
pytz==2022.1
requests==2.31.0
scikit-learn==1.3.2
scipy==1.10.1
selenium==4.3.0
six==1.16.0
sniffio==1.2.0
sortedcontainers==2.4.0
SQLAlchemy==1.4.45
sqlparse==0.4.2
threadpoolctl==3.2.0
trio==0.21.0
trio-websocket==0.9.2
typing_extensions==4.7.1
tzdata==2022.1
urllib3==1.26.11
urllib3-secure-extra==0.1.0
virtualenv==20.24.3
virtualenvwrapper-win==1.2.7
werkzeug==2.3.7
wordcloud==1.8.2.2
wsproto==1.1.0
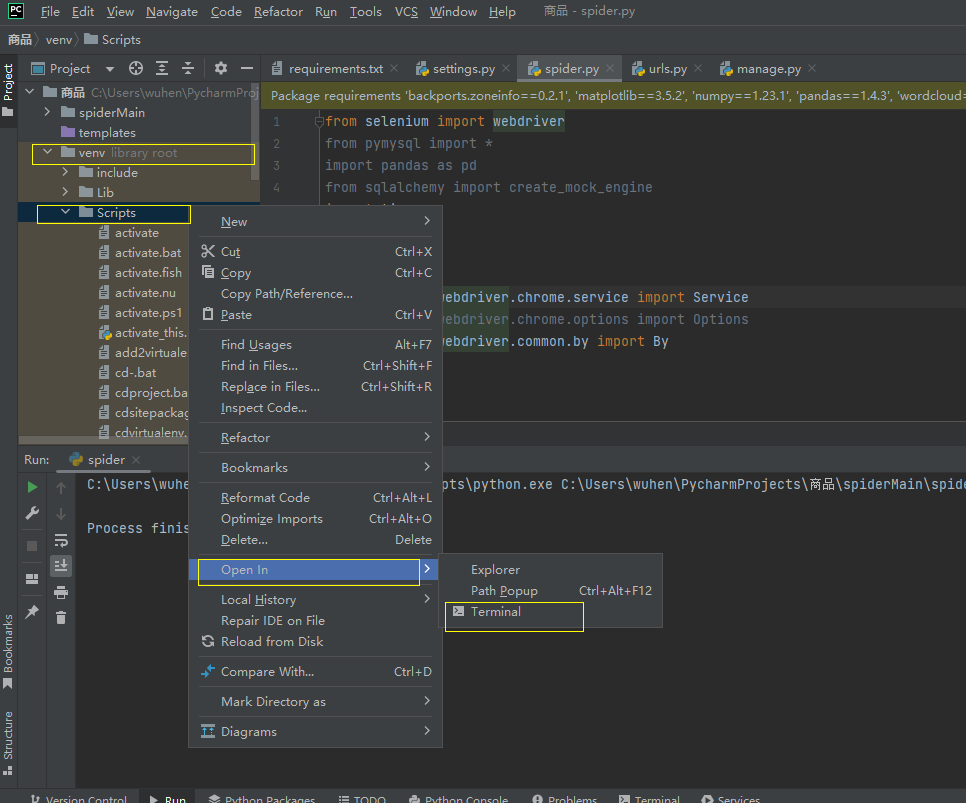
zipp==3.8.0将requirements.txt文件复制到同名目录下:

打开终端
安装依赖,在终端输入
1
pip install -r ..\..\requirements.txt
查看安装的依赖
3.基础配置
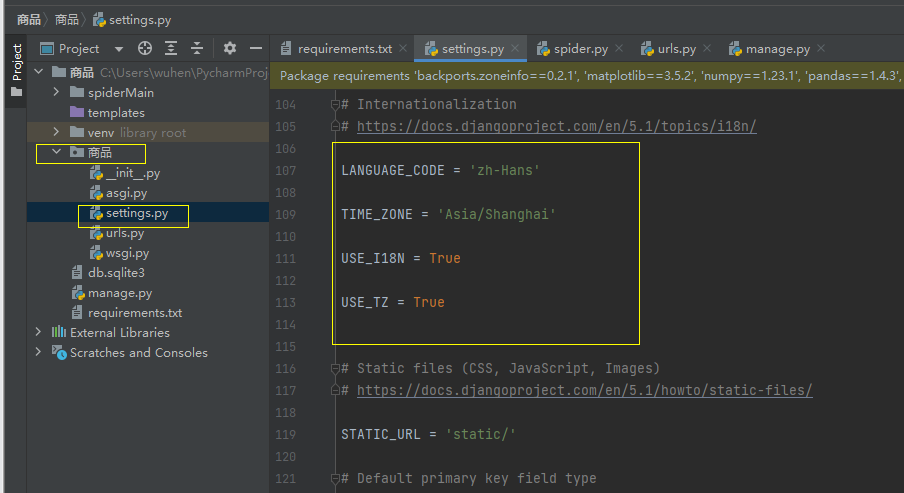
修改语言,时区
1
2
3LANGUAGE_CODE = 'zh-Hans'
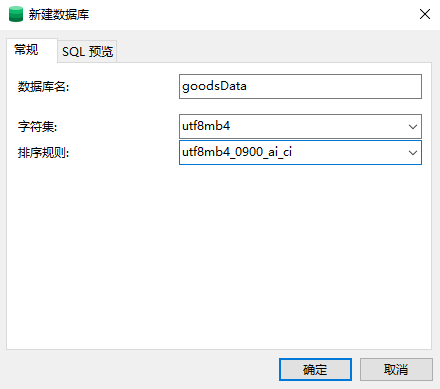
TIME_ZONE = 'Asia/Shanghai'配置数据库
在Navicat中创建数据库goodsData:
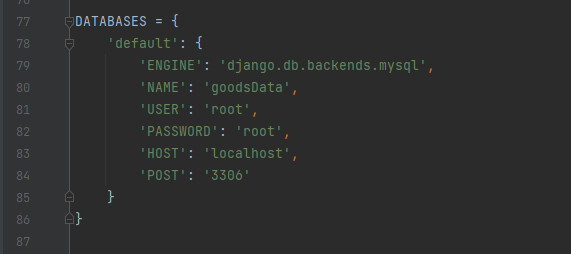
回到settings.py修改:
1
2
3
4
5
6
7
8
9
10DATABASES = {
'default': {
'ENGINE': 'django.db.backends.mysql',
'NAME': 'goodsData',
'USER': 'root',
'PASSWORD': 'root',
'HOST': 'localhost',
'POST': '3306'
}
}
2.爬虫
新建一个spiderMain文件夹,并且在spiderMain文件夹创建一个spider.py文件,如: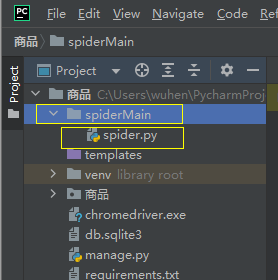
1.软件安装
需要下载chrome浏览器和chromedriver.exe驱动。
查看Chrome的版本号
下载ChromeDriver
1
2
3ChromeDriver下载地址:
版本在114及以下:http://chromedriver.storage.googleapis.com/index.html
版本在127:https://googlechromelabs.github.io/chrome-for-testing/#stable将chromedriver.exe放在spiderMain文件夹下
将chrome的目录添加在环境变量中
1
C:\Program Files\Google\Chrome\Application
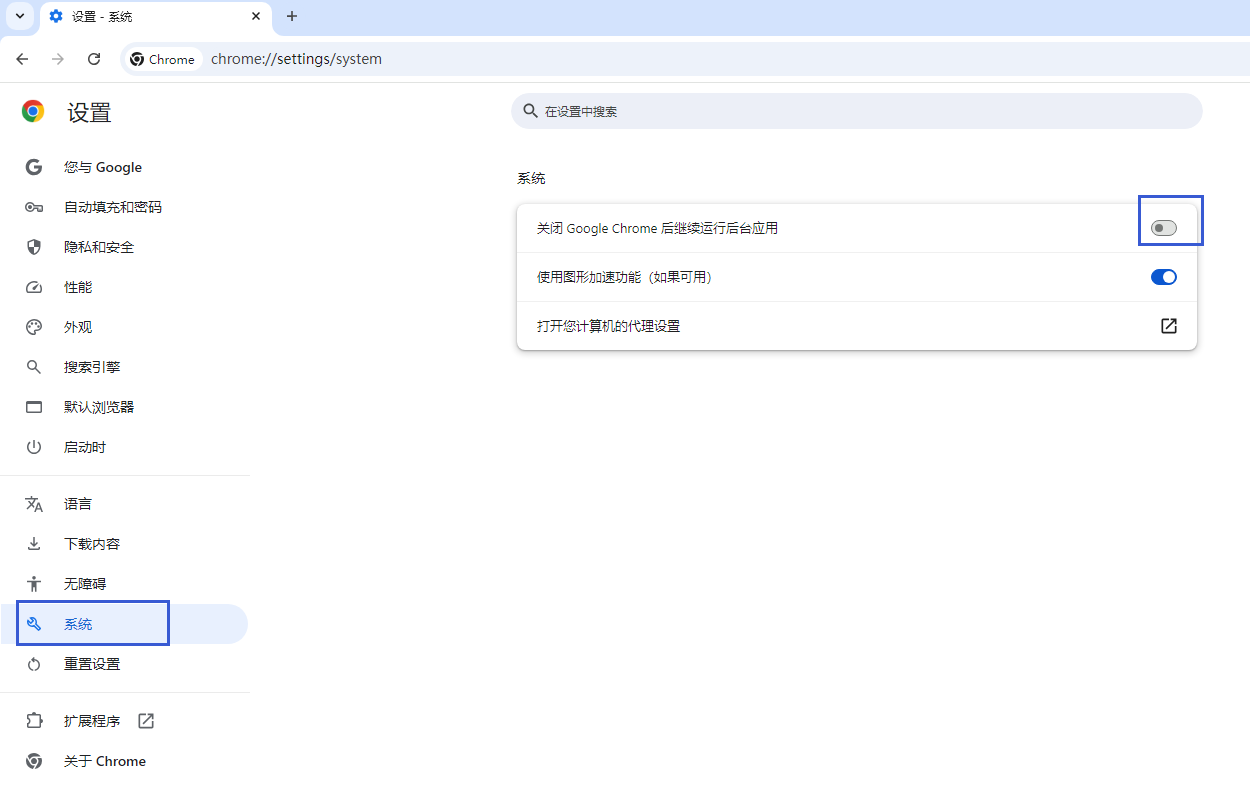
chrome浏览器设置
可以防止浏览器打开新的页面,被爬取数据的网页系统监测到
chrome浏览器端口设置
用管理员身份运行cmd输入
1
chrome.exe --remote-debugging-port=9223
注:出现报错是没有进行第4步的配置,只需要配置第4步后,重新执行第6步即可

2.爬虫编写
注意:运行代码时,一定要点开浏览器,并且是对应的端口号
*1.导入所需的依赖
1 | from selenium import webdriver |
*2.创建浏览器对象
目标:使用chromedriver.exe打开需要爬取数据的网页
1 | if __name__ == '__main__': |
*3.数据初始化(init)
目标:用来创建存储数据的文件,并且初始化文件的内容
1 | # 创建存取数据的文件data.csv |
*4.获取指定的数据类型
目标:通过key参数来传递数据,能够获取对应key值得搜索
例如:获取购物网站上衣物,食品,电器等不同类型的数据得搜索
1 | # 通过key参数,传递搜索的关键字 |
*5.获取对应的产品信息
目标:获取到当页的需要的数据信息,并且实现下一页的翻页
1 | # 获取对应的产品信息 |
*6.保存数据
1 | # 数据保存到CSV文件夹中 |
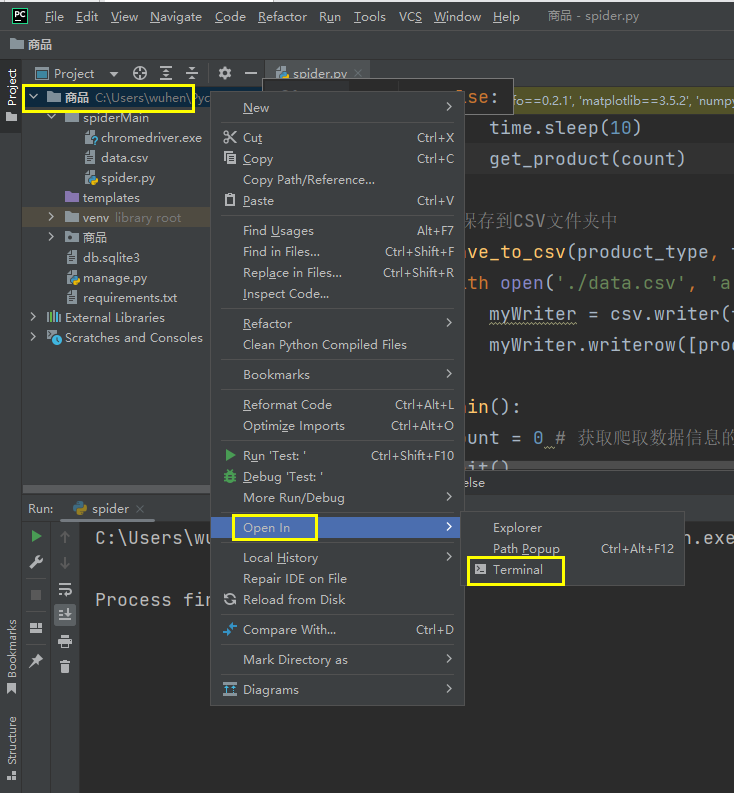
7.创建数据库的表
打开命令行
创建一个app,输入:
1
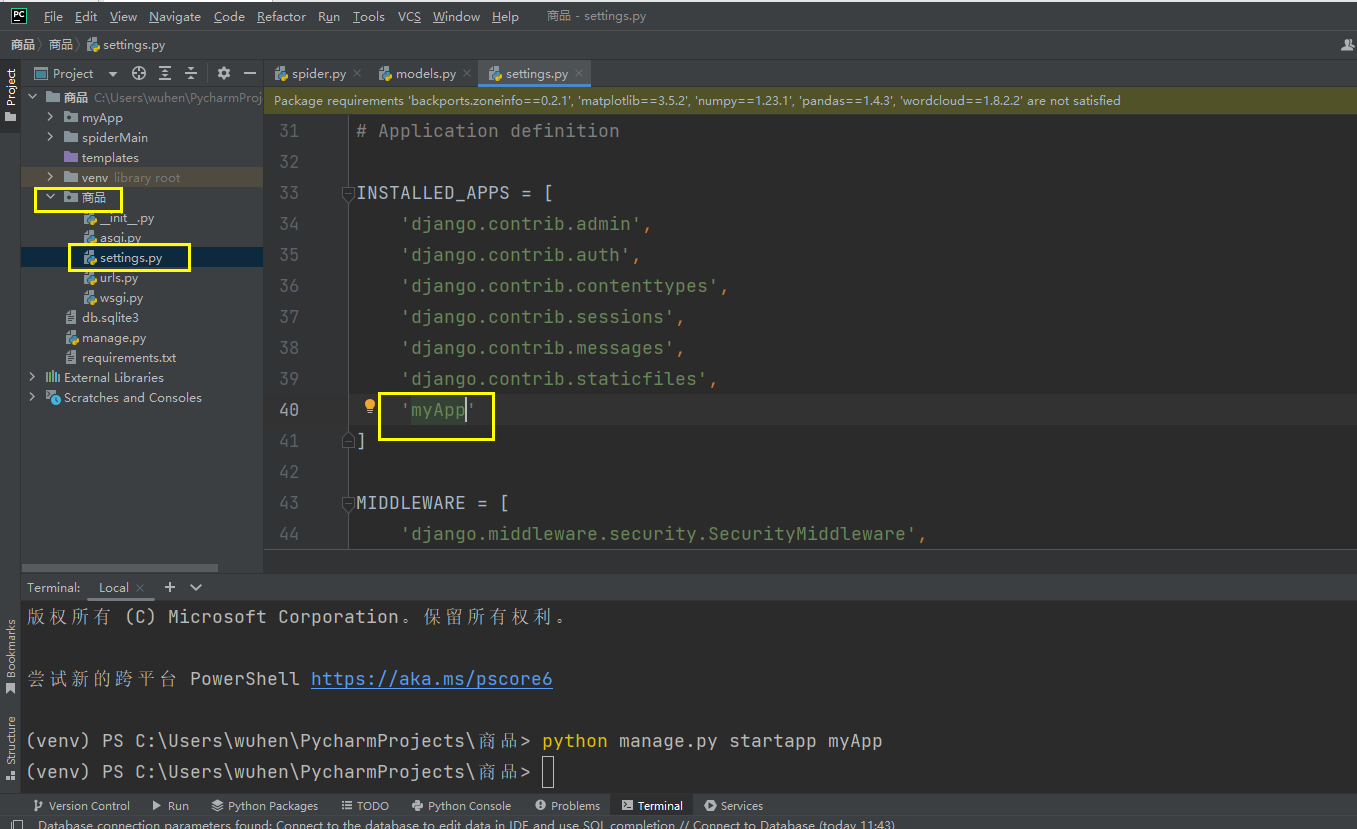
python manage.py startapp myApp
配置settings.py,添加:
1
'myApp'
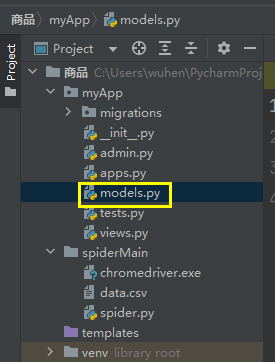
编写models.py
编写代码:
1
2
3
4
5
6
7
8
9
10
11
12
13
14
15
16
17
18
19
20
21
22
23
24
25
26
27
28
29
30
31
32from django.db import models
# Create your models here.
from django.db import models
# 商品表
class Products(models.Model):
id = models.AutoField('id',primary_key=True)
type = models.CharField('商品类型', max_length=255,default='')
title = models.CharField('商品名称', max_length=255, default='')
price = models.CharField('商品价格', max_length=255, default='')
buy_len = models.CharField('商品销量', max_length=255, default='')
img_src = models.CharField('图片', max_length=2555, default='')
name = models.CharField('店铺名', max_length=255, default='')
address = models.CharField('地址', max_length=255, default='')
isFreeDelivery = models.CharField('是否包邮', max_length=255, default='')
href = models.CharField('详情链接', max_length=2555, default='')
nameHref = models.CharField('店铺详情链接', max_length=2555, default='')
class Meta:
db_table = "products"
# 用户表
class User(models.Model):
id = models.AutoField('id', primary_key=True)
username = models.CharField('用户名', max_length=255, default='')
password = models.CharField('密码', max_length=255, default='')
createTime = models.DateTimeField("创建时间",auto_now_add=True)
class Meta:
db_table = "user"创建数据库
在终端输入:
1
python manage.py makemigrations
接着输入,即可将表创建成功(可在navicat中查看):
1
python manage.py migrate
*8.数据清洗
目标:对数据进行清洗
1 | # 数据清洗 |
*9.数据保存到数据库
1 | def save_to_sql(): |
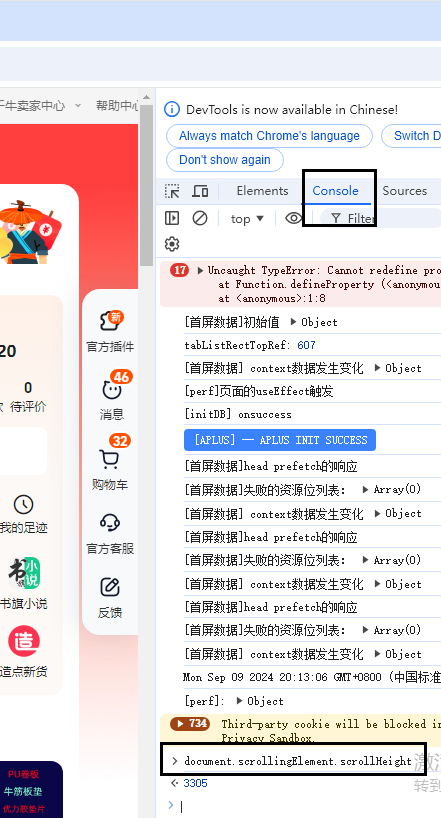
10.爬虫优化
目标:自动完成页面滚动,脱离人工
查看整个网页的高度
实现浏览器滚动
1
2
3
4
5
6
7
8
9
10
11# 爬虫的优化
scroll_position = 0
scroll_amount = 200 # 一次滚动的距离
max_scroll = 7000
# 实现浏览器滚动
if scroll_position < max_scroll:
scroll_script = f"window.scrollBy(0,{scroll_amount});"
brower.execute_script(scroll_script)
scroll_position += scroll_amount
11.爬虫完整代码
1 | from selenium import webdriver |
3.前端
为了更加注重后端的编写,所以此项目的前端使用的是模板。
vscode格式化快捷键:shift + alt + f
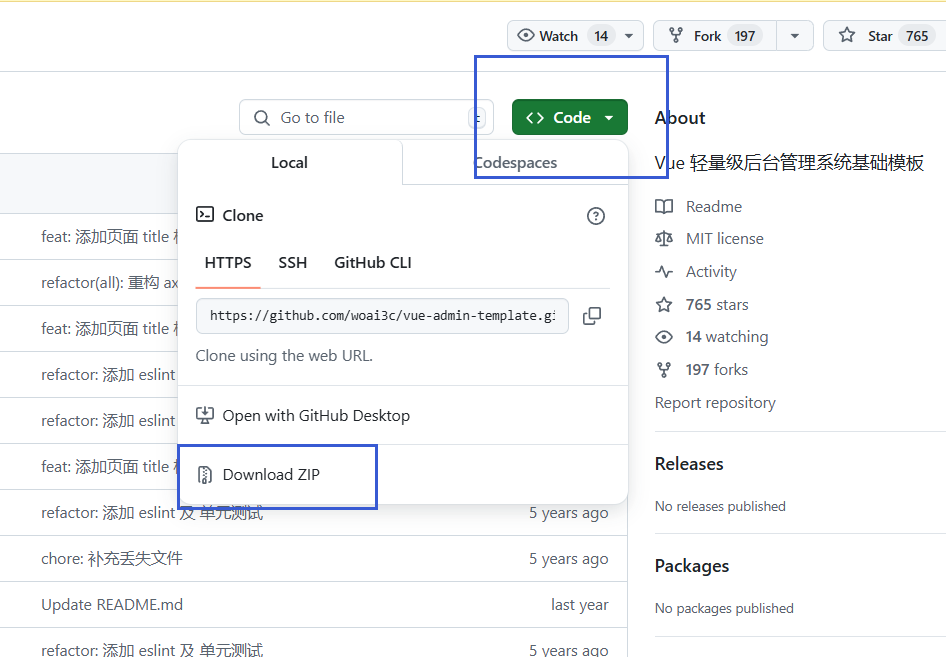
1.前端–初始化
模板网页链接: 轻量级后台管理系统基础模板
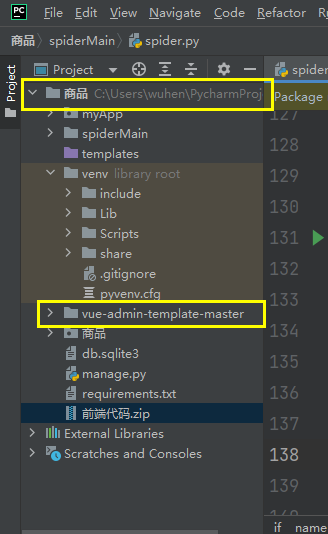
解压到项目文件夹下
在vscode中打开解压后的文件夹
在vscode的终端中下载package.json,并且一定要删除package-lock.json文件
在终端输入(若node.js安装在C盘,右键管理员身份运行vscode):
1
npm install
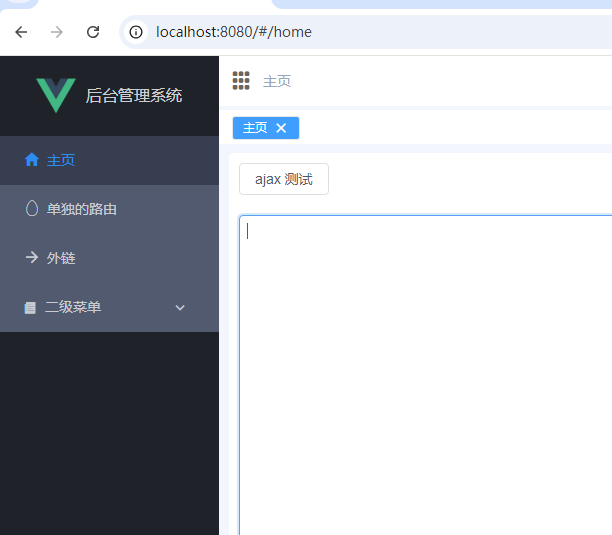
启动项目
1
2
3npm run serve
若出现报错,则输入:npm run lint -- --fix可在浏览器输入,查看:
1
http://localhost:8080
eslin注释(或删除)
1
2
3"lint": "vue-cli-service lint",
"@vue/cli-plugin-babel": "^4.1.0",ctrl+c停止项目,然后重启项目
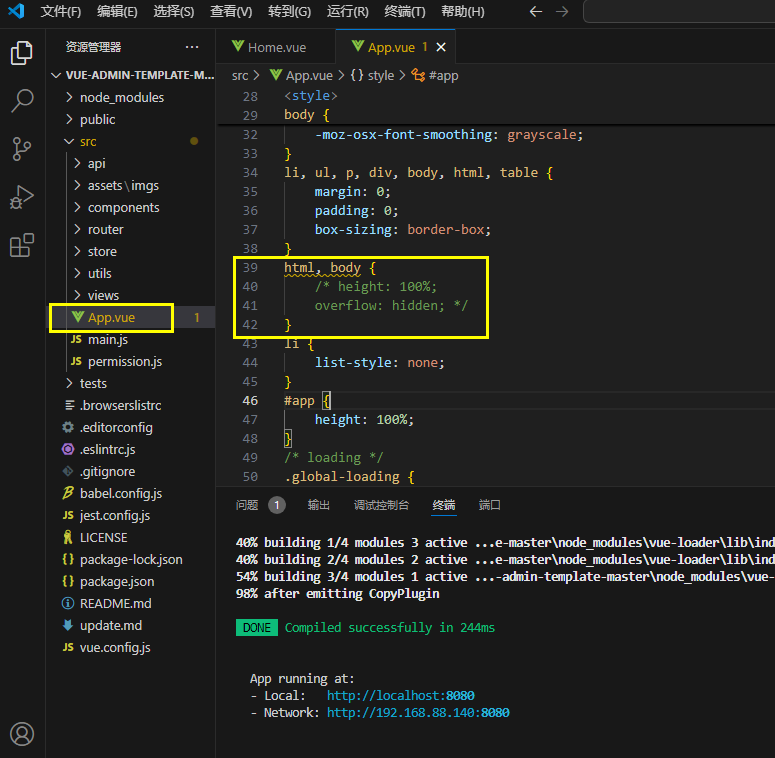
2.前端–大屏样式
注释app.vue中的内容(快捷键ctrl + /)
作用:让网页能够向下滑动
网页布局
1
2
3
4
5
6
7
8
9
10
11
12
13
14
15
16
17
18
19
20
21
22
23
24
25
26
27
28
29
30
31
32
33
34
35
36
37
38
39
40
41
42
43
44
45
46
47
48
49
50
51
52
53
54
55
56
57
58
59
60
61
62
63
64
65
66
67
68
69<style scoped>
/*设置整体*/
.layout {
height: 100vh;
width: 100%;
background: url('../assets/imgs/bg03.jpg');
}
.header {
display: flex;
align-items: center;
justify-content: center;
}
.header div {
width: 50%;
text-align: center;
display: flex;
align-items: center;
justify-content: center;
flex-direction: column;
}
.header div span {
color: steelblue;
font-weight: bold;
font-size: 23px;
padding: 10px;
}
.content {
width: 100%;
height: 100%;
display: flex;
flex-direction: row;
}
.content .left {
display: flex;
align-items: center;
justify-content: center;
flex-direction: column;
height: 80%;
width: 350px;
}
.content .left div {
flex-grow: 1;
height: 300px;
width: 300px;
padding: 5px;
}
.content .right {
display: flex;
align-items: center;
justify-content: center;
flex-direction: column;
height: 80%;
width: 350px;
}
.content .right div {
flex-grow: 1;
height: 300px;
width: 300px;
padding: 5px;
}
.content .center {
display: flex;
align-items: center;
justify-content: center;
flex-direction: column;
height: 80%;
width: 600px;
}
</style>-
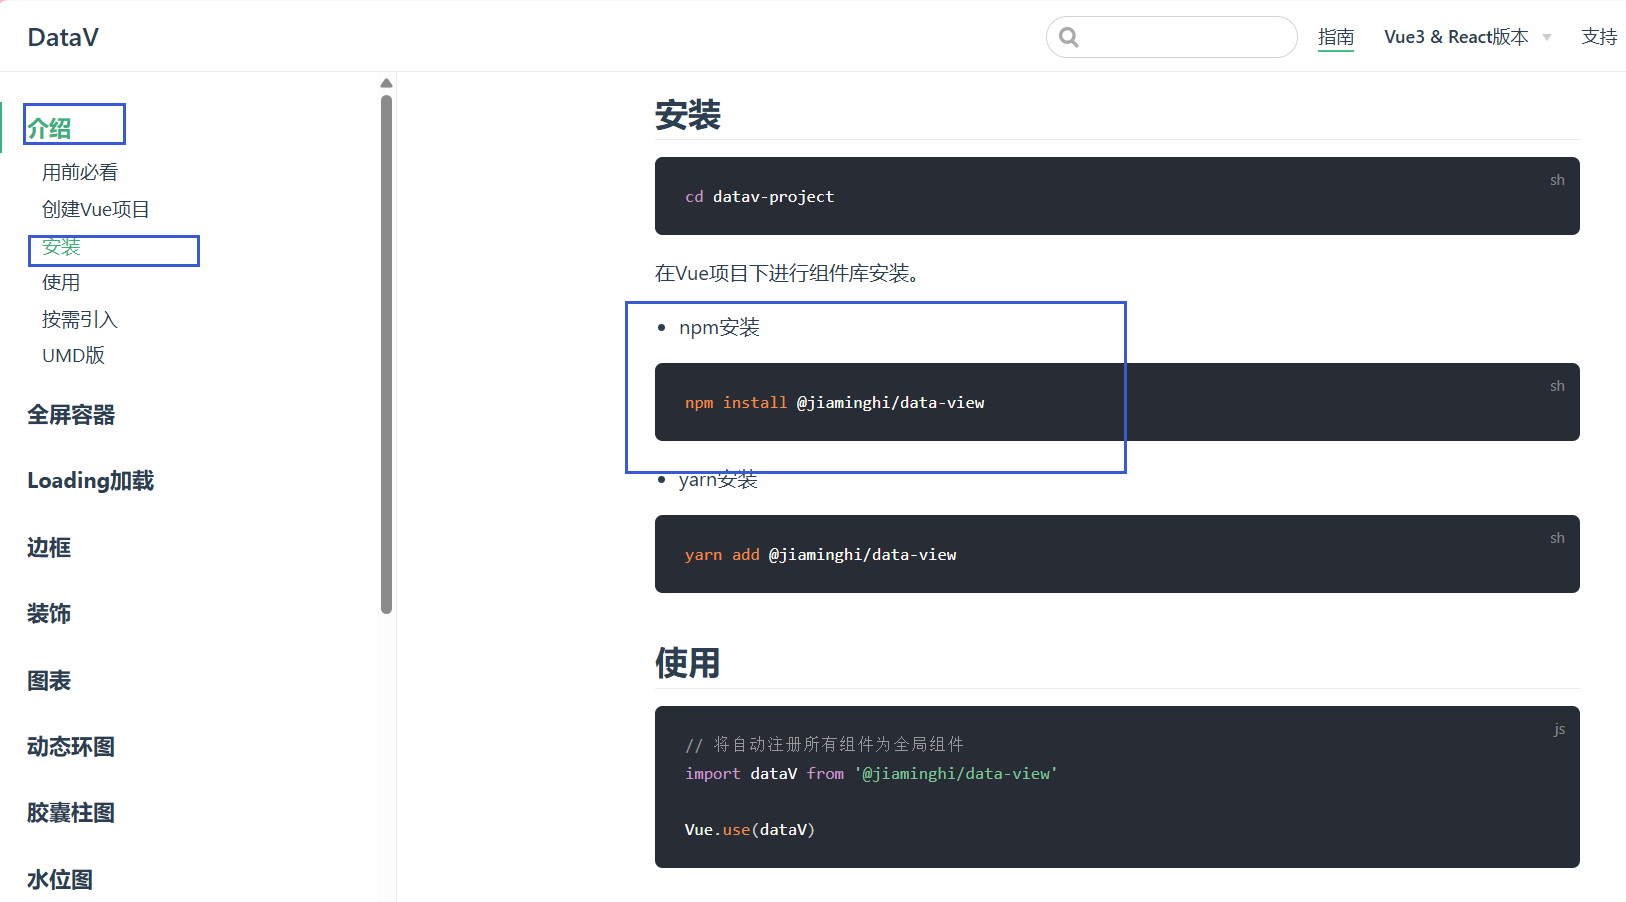
- 找到安装依赖
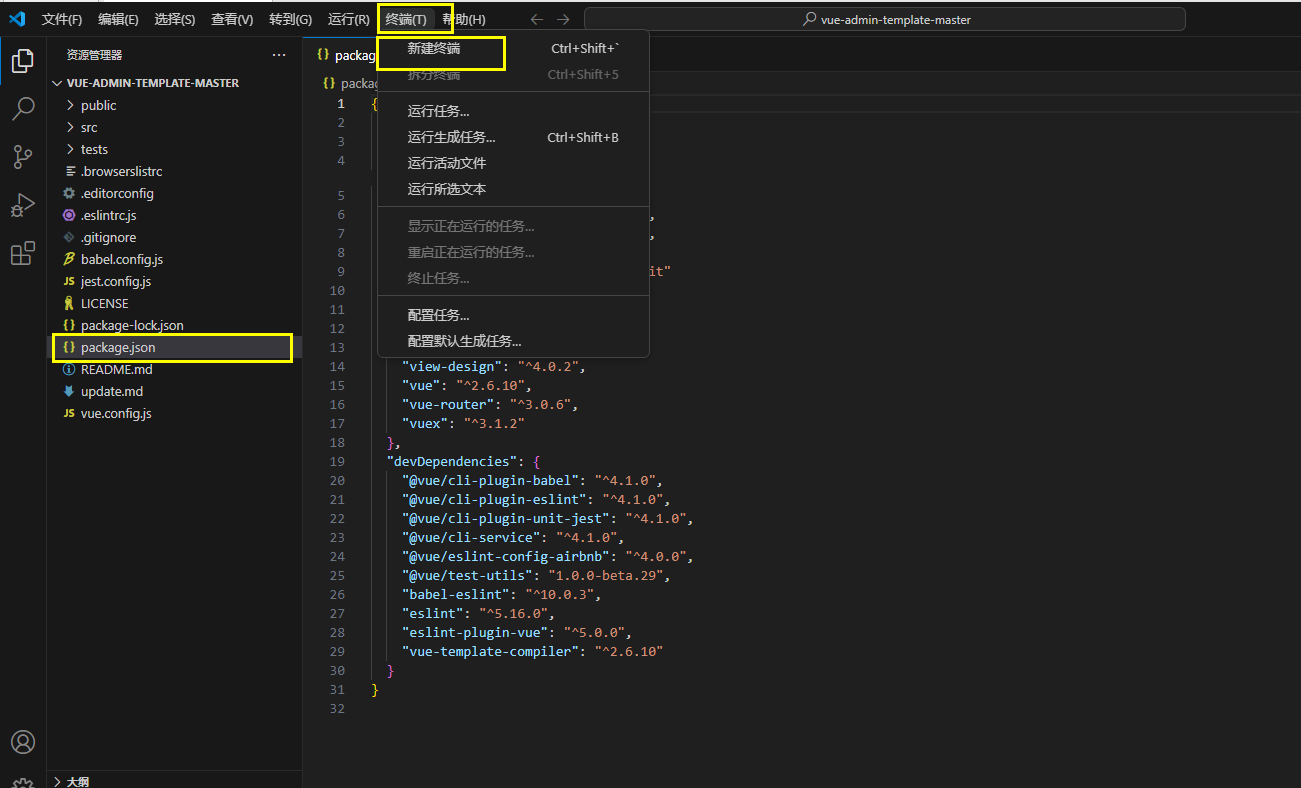
在vscode中新建一个终端,输入:
1
2
3npm install @jiaminghi/data-view
注:若安装失败,需要使用管理员身份运行vscode
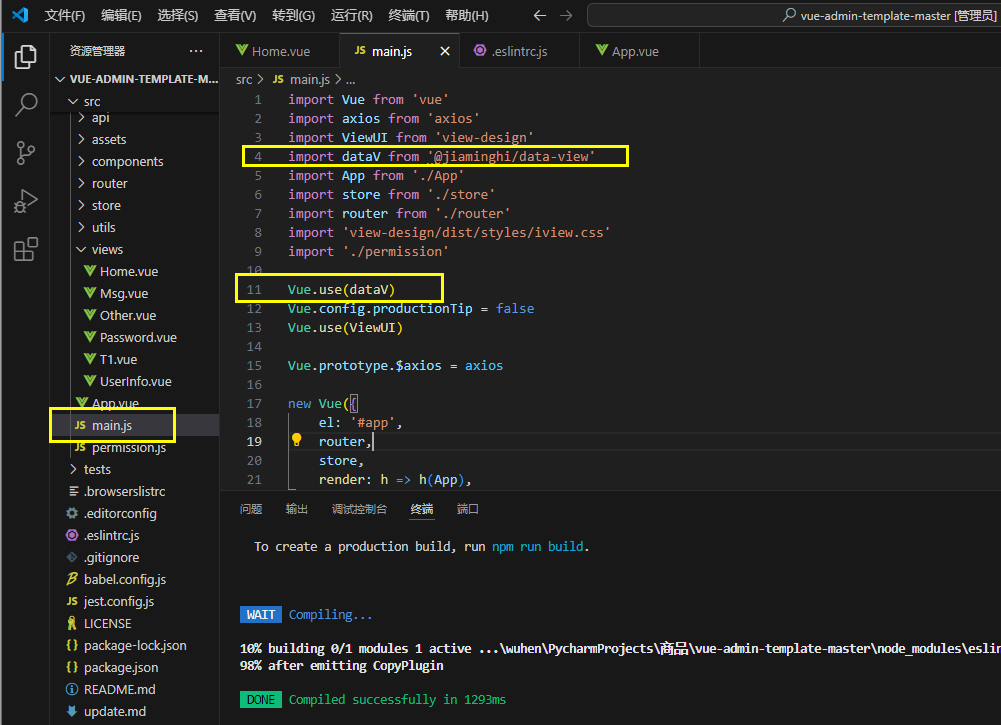
在main.js中引入datav,输入:
注意导入的依赖一定要在import App from ‘./App’之前
1
2
3import { borderBox1 } from '@jiaminghi/data-view'
Vue.use(borderBox1)样式的home.vue文件代码:
1
2
3
4
5
6
7
8
9
10
11
12
13
14
15
16
17
18
19
20
21
22
23
24
25
26
27
28
29
30
31
32
33
34
35
36
37
38
39
40
41
42
43
44
45
46
47
48
49
50
51
52
53
54
55
56
57
58
59
60
61
62
63
64
65
66
67
68
69
70
71
72
73
74
75
76
77
78
79
80
81
82
83
84
85
86
87
88
89
90
91
92
93
94
95
96
97
98
99
100
101
102
103
104
105
106
107
108
109
110
111
112
113
114<template>
<div class="layout">
<!-- 头部 -->
<div class="header">
<dv-decoration-8 style="width:300px;height:50px;" />
<div>
<span class="title-text">大数据可视化平台</span>
<dv-decoration-5 style="width:300px;height:40px;" />
</div>
<dv-decoration-8 :reverse="true" style="width:300px;height:50px;" />
</div>
<!-- 内容 -->
<div class="content">
<div class="left">
<dv-border-box-13>
<dv-decoration-1 style="width:200px;height:10px;" />
<div></div>
</dv-border-box-13>
<dv-border-box-8><div></div></dv-border-box-8>
</div>
<div class="center">
<div></div>
</div>
<div class="right">
<dv-border-box-12>
<dv-decoration-3 style="width:250px;height:10px;" />
<div></div>
</dv-border-box-12>
<dv-border-box-1><div></div></dv-border-box-1>
</div>
</div>
</div>
</template>
<script>
// 注释
/*
注释
*/
export default {
}
</script>
<style scoped>
/*设置整体*/
.layout {
height: 100vh;
width: 100%;
background: url('../assets/imgs/bg03.jpg');
}
.header {
display: flex;
align-items: center;
justify-content: center;
}
.header div {
width: 50%;
text-align: center;
display: flex;
align-items: center;
justify-content: center;
flex-direction: column;
}
.header div span {
color: steelblue;
font-weight: bold;
font-size: 23px;
padding: 10px;
}
.content {
width: 100%;
height: 100%;
display: flex;
flex-direction: row;
}
.content .left {
display: flex;
align-items: center;
justify-content: center;
flex-direction: column;
height: 80%;
width: 350px;
}
.content .left div {
flex-grow: 1;
height: 300px;
width: 300px;
padding: 5px;
}
.content .right {
display: flex;
align-items: center;
justify-content: center;
flex-direction: column;
height: 80%;
width: 350px;
}
.content .right div {
flex-grow: 1;
height: 300px;
width: 300px;
padding: 5px;
}
.content .center {
display: flex;
align-items: center;
justify-content: center;
flex-direction: column;
height: 80%;
width: 600px;
}
</style>
4.图形绘制(前端 + 后端接口)
1.柱状图
1.柱状图前端
script基础配置(一定要有注释和空格)
1
2
3
4
5
6
7
8
9
10
11
12
13
14<script>
// 注释
export default {
data() {
// 函数体
},
methods: {
// 方法
},
async mounted() {
// 生命周期钩子
},
}
</script>柱状图:使用echarts图表
在终端输入安装echarts:
1
npm install --save echarts
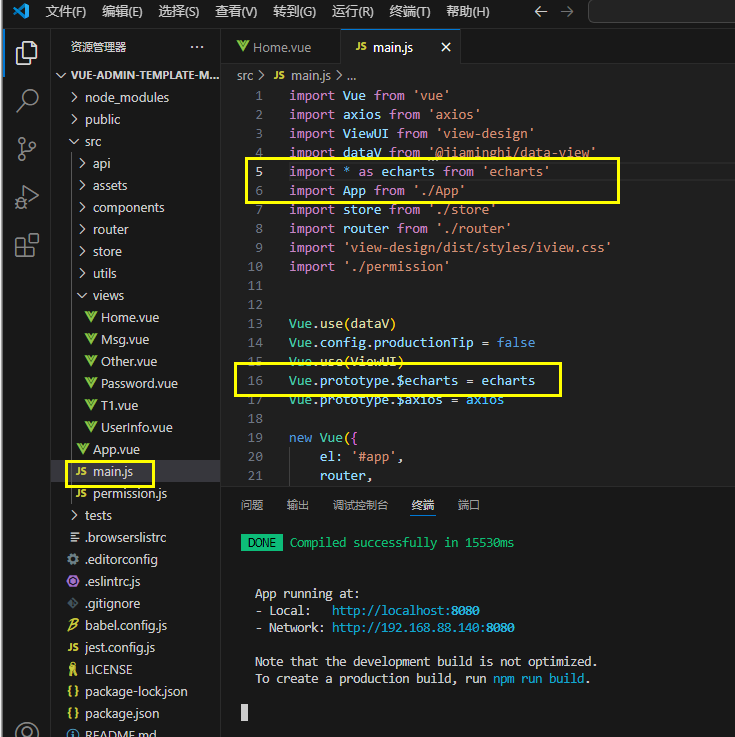
在main.js中引入echarts
1
2
3import * as echarts from 'echarts'
Vue.prototype.$echarts = echarts柱状图
1
2
3
4
5
6
7
8
9
10
11
12
13
14
15
16
17
18
19
20
21
22
23
24
25
26
27
28
29
30
31
32
33
34
35
36<script>
// 注释
export default {
data() {
// 函数体
},
methods: {
// 方法
drawLeftTop() {
let myChart = this.$echarts.init(this.$refs.firstMain)
let option = {
xAxis: {
type: 'category',
data: ['Mon', 'Tue', 'Wed', 'Thu', 'Fri', 'Sat', 'Sun'],
},
yAxis: {
type: 'value',
},
series: [
{
data: [120, 200, 150, 80, 70, 110, 130],
type: 'bar',
},
],
}
if (option) {
myChart.setOption(option)
}
},
},
async mounted() {
// 生命周期
this.drawLeftTop()
},
}
</script>如果报错,在终端输入:
1
2
3npm install -g eslint
npx eslint --fix src/views/Home.vue
最终的Home.vue的代码
1
2
3
4
5
6
7
8
9
10
11
12
13
14
15
16
17
18
19
20
21
22
23
24
25
26
27
28
29
30
31
32
33
34
35
36
37
38
39
40
41
42
43
44
45
46
47
48
49
50
51
52
53
54
55
56
57
58
59
60
61
62
63
64
65
66
67
68
69
70
71
72
73
74
75
76
77
78
79
80
81
82
83
84
85
86
87
88
89
90
91
92
93
94
95
96
97
98
99
100
101
102
103
104
105
106
107
108
109
110
111
112
113
114
115
116
117
118
119
120
121
122
123
124
125
126
127
128
129
130
131
132
133
134
135
136
137
138
139
140
141
142
143
144
145
146
147
148
149
150
151
152
153
154
155<template>
<div class="layout">
<!-- 头部 -->
<div class="header">
<dv-decoration-8 style="width:300px;height:50px;" />
<div>
<span class="title-text">大数据可视化平台</span>
<dv-decoration-5 style="width:300px;height:40px;" />
</div>
<dv-decoration-8 :reverse="true" style="width:300px;height:50px;" />
</div>
<!-- 内容 -->
<div class="content">
<div class="left">
<dv-border-box-13>
<dv-decoration-1 style="width:200px;height:10px;" />
<div ref="firstMain" style="width:300px;height:270px;"></div>
</dv-border-box-13>
<dv-border-box-8>
<div></div>
</dv-border-box-8>
</div>
<div class="center">
<div></div>
</div>
<div class="right">
<dv-border-box-12>
<dv-decoration-3 style="width:250px;height:10px;" />
<div></div>
</dv-border-box-12>
<dv-border-box-1>
<div></div>
</dv-border-box-1>
</div>
</div>
</div>
</template>
<script>
// 注释
export default {
data() {
// 函数体
},
methods: {
// 方法
drawLeftTop() {
let myChart = this.$echarts.init(this.$refs.firstMain)
let option = {
xAxis: {
type: 'category',
data: ['Mon', 'Tue', 'Wed', 'Thu', 'Fri', 'Sat', 'Sun'],
},
yAxis: {
type: 'value',
},
series: [
{
data: [120, 200, 150, 80, 70, 110, 130],
type: 'bar',
},
],
}
if (option) {
myChart.setOption(option)
}
},
},
async mounted() {
// 生命周期
this.drawLeftTop()
},
}
</script>
<style scoped>
/*设置整体*/
.layout {
height: 100vh;
width: 100%;
background: url('../assets/imgs/bg03.jpg');
}
.header {
display: flex;
align-items: center;
justify-content: center;
}
.header div {
width: 50%;
text-align: center;
display: flex;
align-items: center;
justify-content: center;
flex-direction: column;
}
.header div span {
color: steelblue;
font-weight: bold;
font-size: 23px;
padding: 10px;
}
.content {
width: 100%;
height: 100%;
display: flex;
flex-direction: row;
}
.content .left {
display: flex;
align-items: center;
justify-content: center;
flex-direction: column;
height: 80%;
width: 350px;
margin-left: 30px;
}
.content .left div {
flex-grow: 1;
height: 300px;
width: 300px;
padding: 5px;
}
.content .right {
display: flex;
align-items: center;
justify-content: center;
flex-direction: column;
height: 80%;
width: 350px;
}
.content .right div {
flex-grow: 1;
height: 300px;
width: 300px;
padding: 5px;
}
.content .center {
display: flex;
align-items: center;
justify-content: center;
flex-direction: column;
height: 80%;
width: 600px;
}
</style>
2.柱状图后端接口
1.流程
创建好下图的几个文件
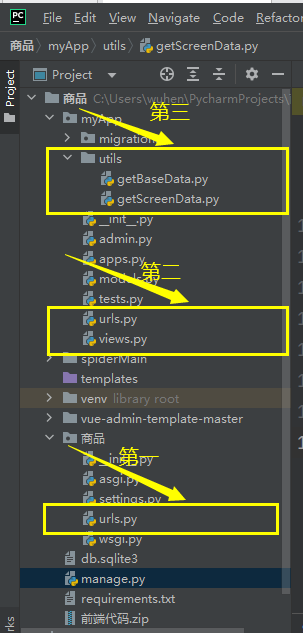
1 | 1.商品/urls.py:配置路由 |
2.实现
商品/urls.py
1
2
3
4
5
6
7
8from django.contrib import admin
from django.urls import path,include
urlpatterns = [
path('admin/', admin.site.urls),
path('myApp/',include('myApp.urls'))
]myApp/urls.py
1
2
3
4
5
6from django.urls import path
from myApp import views
urlpatterns = [
path("screenData/", views.screenData,name="screenData"),
]myApp/views.py
1
2
3
4
5
6
7
8
9
10
11
12
13from django.shortcuts import render
from django.http import JsonResponse
from .utils import getScreenData
# Create your views here.
def screenData(request):
if request.method == "GET":
cityList,volumnList = getScreenData.getSquareData()
return JsonResponse({
'cityList' : cityList,
'volumnList' : volumnList
})myApp/utils/getScreenData.py
1
2
3
4
5
6
7
8
9
10
11
12
13
14
15
16
17from .getBaseData import *
def getSquareData():
goods = list(getAllGoods())
goodVolumn = {}
for i in goods:
if goodVolumn.get(i.address,-1): # 未获取到键,则赋值给销量
goodVolumn[i.address] = int(i.buy_len)
else:
goodVolumn[i.address] += int(i.buy_len)
goodsSortVolumn = sorted(goodVolumn.items(),key=lambda x:x[1],reverse=True) # 对销量排序
cityList = []
volumnList = []
for i in goodsSortVolumn:
cityList.append(i[0])
volumnList.append(i[1])
return cityList[:7],volumnList[:7]myApp/utils/getBaseData.py
1
2
3
4
5
6from myApp.models import *
def getAllGoods():
# 引入Products表中的所有数据
return Products.objects.all()
3.实现前后端关联
1.跨域的实现
为了防止前后端的端口号不同,出现跨域问题。需在pycharm项目的settings.py中设置:
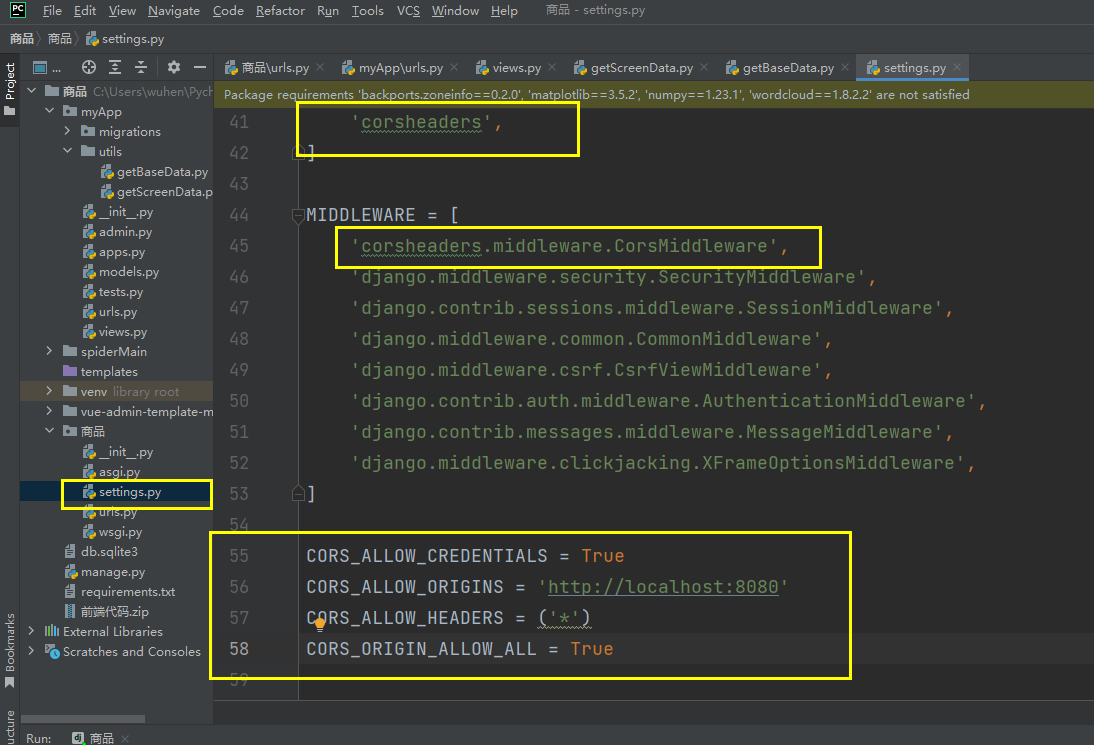
1 | 'corsheaders', |
2.前端发送请求与接受数据
流程:
1
前端 -(发送请求)-> 后端 -(数据接收)-> 前端
前端编写流程
1
2
31.src/api/index.js:封装HTTP请求
2.src/main.js:全局注册HTTP客户端
3.src/views/Home.vue:发送HTTP请求
3.前端编写
src/api/index.js
1
2
3
4
5
6
7
8import axios from 'axios'
const service = axios.create({
baseURL: 'http://127.0.0.1:8000/',
timeout: 40000,
})
export default servicesrc/main.js
1
2
3import $http from '@/api/index.js'
Vue.prototype.$http = $httpsrc/views/Home.vue
1
2
3
4
5
6
7
8
9
10
11
12
13
14
15
16
17
18
19
20
21
22
23
24
25
26
27
28
29
30
31
32
33
34
35
36
37
38
39
40
41
42
43
44
45
46
47
48// 发送请求
<script>
// 注释
export default {
data() {
// 函数体
return {
realData: {
cityList: [1],
volumnList: [1],
},
}
},
methods: {
// 方法
drawLeftTop() {
let myChart = this.$echarts.init(this.$refs.firstMain)
let option = {
xAxis: {
type: 'category',
data: this.realData.cityList,
},
yAxis: {
type: 'value',
},
series: [
{
data: this.realData.volumnList,
type: 'bar',
},
],
}
if (option) {
myChart.setOption(option)
}
},
},
async mounted() {
// 生命周期
// 异步请求,使用await
const res = await this.$http.get('myApp/screenData/')
// 接收数据
this.$set(this.realData, 'cityList', res.data.cityList)
this.$set(this.realData, 'volumnList', res.data.volumnList)
this.drawLeftTop()
},
}
</script>以及修改表的x,y轴的数据
1
2
3
4
5
6
7
8
9
10
11
12
13
14
15let option = {
xAxis: {
type: 'category',
data: this.realData.cityList,
},
yAxis: {
type: 'value',
},
series: [
{
data: this.realData.volumnList,
type: 'bar',
},
],
}美化图形
1
2
3
4
5
6
7
8
9
10
11
12
13
14
15
16
17
18
19
20
21
22
23
24
25
26
27
28
29
30
31
32
33
34
35
36
37
38
39
40
41
42
43
44
45
46
47
48
49
50
51
52
53
54
55
56
57
58
59
60
61
62
63
64
65
66
67
68
69
70
71
72
73
74
75
76
77
78
79
80
81
82
83
84
85
86
87
88
89
90
91
92
93
94
95
96
97
98
99
100
101
102
103
104
105
106
107
108
109
110
111
112
113
114
115
116
117
118
119
120
121
122
123
124
125
126
127
128
129
130
131
132
133
134
135
136
137
138
139
140
141
142
143
144
145
146
147<script>
import { color } from 'echarts'
import * as echarts from 'echarts'
import { readonly } from 'vue'
// 注释
export default {
data() {
// 函数体
return {
isHovered: true,
realData: {
cityList: [1],
volumnList: [1],
},
}
},
methods: {
// 方法
drawLeftTop() {
let myChart = this.$echarts.init(this.$refs.firstMain)
let option = {
xAxis: {
type: 'category',
data: this.realData.cityList,
axisLabel: {
textStyle: {
color: '#C0C0C0',
},
},
},
dataZoom: [
{
type: 'slider',
start: 0,
end: 85,
show: false,
},
],
title: {
text: '各地区销售数据',
textStyle: {
color: '#C0C0C0',
},
},
toolbox: {
show: true,
feature: {
// dataView: { show: true, realData: true },
magicType: { show: true, type: ['line', 'bar'] },
restore: { show: true },
SaveAsImage: { show: true },
},
},
legend: {
orient: 'vertical',
right: 'right',
data: ['销售数据'],
textStyle: {
color: 'grey',
},
top: '8%',
left: '70%',
},
tooltip: {
trigger: 'item',
formatter: '',
},
yAxis: {
type: 'value',
axisLabel: {
textStyle: {
color: '#C0C0C0',
},
},
},
series: [
{
name: '销售数据',
data: this.realData.volumnList,
type: 'bar',
label: {
show: true,
position: 'top',
textStyle: {
color: '#C0C0C0',
},
},
},
],
}
if (option) {
myChart.setOption(option)
}
},
changeData(x) {
let st = x[0]
for (let i = 0; i < x.length - 1; i++) {
x[i] = x[i + 1]
}
x[x.length - 1] = st
},
updataBarChart() {
if (this.isHovered == true) {
this.changeData(this.realData.cityList)
this.changeData(this.realData.volumnList)
let myChart = this.$echarts.init(this.$refs.firstMain)
myChart.setOption({
xAxis: {
data: this.realData.cityList,
},
series: [
{
data: this.realData.volumnList,
},
],
})
} else {
clearInterval(this.timer)
}
},
startDataupdataInterval() {
const interval = 2000
clearInterval(this.timer)
setInterval(this.updataBarChart, interval)
},
startAction() {
this.isHovered = false
},
cancelAction() {
this.isHovered = true
},
},
async mounted() {
// 生命周期
// 异步请求,使用await
const res = await this.$http.get('myApp/screenData/')
// 接收数据
this.$set(this.realData, 'cityList', res.data.cityList)
this.$set(this.realData, 'volumnList', res.data.volumnList)
},
async updated() {
this.drawLeftTop()
this.startDataupdataInterval()
},
}
</script>
4.Home.vue的完整代码
1 | <template> |
2.饼状图
1.饼状图前端
饼状图:使用echarts图表
1
2
3
4
5
6
7
8
9
10
11
12
13
14
15
16
17
18
19
20
21
22
23
24
25
26
27
28
29
30
31
32
33
34
35
36
37
38
39
40
41drawLeftBottom() {
let myChart = this.$echarts.init(this.$refs.secondMain)
let option = {
title: {
text: 'Referer of a Website',
subtext: 'Fake Data',
left: 'center',
},
tooltip: {
trigger: 'item',
},
legend: {
orient: 'vertical',
left: 'left',
},
series: [
{
name: 'Access From',
type: 'pie',
radius: '50%',
data: [
{ value: 1048, name: 'Search Engine' },
{ value: 735, name: 'Direct' },
{ value: 580, name: 'Email' },
{ value: 484, name: 'Union Ads' },
{ value: 300, name: 'Video Ads' },
],
emphasis: {
itemStyle: {
shadowBlur: 10,
shadowOffsetX: 0,
shadowColor: 'rgba(0, 0, 0, 0.5)',
},
},
},
],
}
if (option) {
myChart.setOption(option)
}
},最终的Home.vue的代码
1
2
3
4
5
6
7
8
9
10
11
12
13
14
15
16
17
18
19
20
21
22
23
24
25
26
27
28
29
30
31
32
33
34
35
36
37
38
39
40
41
42
43
44
45
46
47
48
49
50
51
52
53
54
55
56
57
58
59
60
61
62
63
64
65
66
67
68
69
70
71
72
73
74
75
76
77
78
79
80
81
82
83
84
85
86
87
88
89
90
91
92
93
94
95
96
97
98
99
100
101
102
103
104
105
106
107
108
109
110
111
112
113
114
115
116
117
118
119
120
121
122
123
124
125
126
127
128
129
130
131
132
133
134
135
136
137
138
139
140
141
142
143
144
145
146
147
148
149
150
151
152
153
154
155
156
157
158
159
160
161
162
163
164
165
166
167
168
169
170
171
172
173
174
175
176
177
178
179
180
181
182
183
184
185
186
187
188
189
190
191
192
193
194
195
196
197
198
199
200
201
202
203
204
205
206
207
208
209
210
211
212
213
214
215
216
217
218
219
220
221
222
223
224
225
226
227
228
229
230
231
232
233
234
235
236
237
238
239
240
241
242
243
244
245
246
247
248
249
250
251
252
253
254
255
256
257
258
259
260
261
262
263
264
265
266
267
268
269
270
271
272
273
274
275
276
277
278
279
280
281
282
283
284
285
286
287
288
289
290
291
292
293
294
295
296
297
298
299
300
301
302
303
304
305
306
307
308
309
310<template>
<div class="layout">
<!-- 头部 -->
<div class="header">
<dv-decoration-8 style="width:300px;height:50px;" />
<div>
<span class="title-text">大数据可视化平台</span>
<dv-decoration-5 style="width:300px;height:40px;" />
</div>
<dv-decoration-8 :reverse="true" style="width:300px;height:50px;" />
</div>
<!-- 内容 -->
<div class="content">
<div class="left">
<dv-border-box-13>
<dv-decoration-1 style="width:200px;height:10px;" />
<div ref="firstMain" style="width:350px;height:270px;" v-bind:key="realData.volumnList[0]"
@mouseenter="startAction" @mouseleave="cancelAction"></div>
</dv-border-box-13>
<dv-border-box-8>
<div ref="secondMain" style="width:350px;height:270px;"></div>
</dv-border-box-8>
</div>
<div class="center">
<div></div>
</div>
<div class="right">
<dv-border-box-12>
<dv-decoration-3 style="width:250px;height:10px;" />
<div></div>
</dv-border-box-12>
<dv-border-box-1>
<div></div>
</dv-border-box-1>
</div>
</div>
</div>
</template>
<script>
import { color } from 'echarts'
import * as echarts from 'echarts'
import { readonly } from 'vue'
// 注释
export default {
data() {
// 函数体
return {
isHovered: true,
realData: {
cityList: [1],
volumnList: [1],
},
}
},
methods: {
// 方法
drawLeftTop() {
let myChart = this.$echarts.init(this.$refs.firstMain)
let option = {
xAxis: {
type: 'category',
data: this.realData.cityList,
axisLabel: {
textStyle: {
color: '#C0C0C0',
},
},
},
dataZoom: [
{
type: 'slider',
start: 0,
end: 85,
show: false,
},
],
title: {
text: '各地区销售数据',
textStyle: {
color: '#C0C0C0',
},
},
toolbox: {
show: true,
feature: {
// dataView: { show: true, realData: true },
magicType: { show: true, type: ['line', 'bar'] },
restore: { show: true },
SaveAsImage: { show: true },
},
},
legend: {
orient: 'vertical',
right: 'right',
data: ['销售数据'],
textStyle: {
color: 'grey',
},
top: '8%',
left: '70%',
},
tooltip: {
trigger: 'item',
formatter: '',
},
yAxis: {
type: 'value',
data: this.realData.volumnList,
axisLabel: {
textStyle: {
color: '#C0C0C0',
},
},
},
series: [
{
name: '销售数据',
data: this.realData.volumnList,
type: 'bar',
label: {
show: true,
position: 'top',
textStyle: {
color: '#C0C0C0',
},
},
},
],
}
if (option) {
myChart.setOption(option)
}
},
drawLeftBottom() {
let myChart = this.$echarts.init(this.$refs.secondMain)
let option = {
title: {
text: 'Referer of a Website',
subtext: 'Fake Data',
left: 'center',
},
tooltip: {
trigger: 'item',
},
legend: {
orient: 'vertical',
left: 'left',
},
series: [
{
name: 'Access From',
type: 'pie',
radius: '50%',
data: [
{ value: 1048, name: 'Search Engine' },
{ value: 735, name: 'Direct' },
{ value: 580, name: 'Email' },
{ value: 484, name: 'Union Ads' },
{ value: 300, name: 'Video Ads' },
],
emphasis: {
itemStyle: {
shadowBlur: 10,
shadowOffsetX: 0,
shadowColor: 'rgba(0, 0, 0, 0.5)',
},
},
},
],
}
if (option) {
myChart.setOption(option)
}
},
changeData(x) {
let st = x[0]
for (let i = 0; i < x.length - 1; i++) {
x[i] = x[i + 1]
}
x[x.length - 1] = st
},
updataBarChart() {
if (this.isHovered == true) {
this.changeData(this.realData.cityList)
this.changeData(this.realData.volumnList)
let myChart = this.$echarts.init(this.$refs.firstMain)
myChart.setOption({
xAxis: {
data: this.realData.cityList,
},
series: [
{
data: this.realData.volumnList,
},
],
})
} else {
clearInterval(this.timer)
}
},
startDataupdataInterval() {
const interval = 2000
clearInterval(this.timer)
setInterval(this.updataBarChart, interval)
},
startAction() {
this.isHovered = false
},
cancelAction() {
this.isHovered = true
},
},
async mounted() {
// 生命周期
// 异步请求,使用await
const res = await this.$http.get('myApp/screenData/')
// 接收数据
this.$set(this.realData, 'cityList', res.data.cityList)
this.$set(this.realData, 'volumnList', res.data.volumnList)
this.drawLeftBottom()
},
async updated() {
this.drawLeftTop()
this.startDataupdataInterval()
},
}
</script>
<style scoped>
/*设置整体*/
.layout {
height: 100vh;
width: 100%;
background: url('../assets/imgs/bg03.jpg');
}
.header {
display: flex;
align-items: center;
justify-content: center;
}
.header div {
width: 50%;
text-align: center;
display: flex;
align-items: center;
justify-content: center;
flex-direction: column;
}
.header div span {
color: steelblue;
font-weight: bold;
font-size: 23px;
padding: 10px;
}
.content {
width: 100%;
height: 100%;
display: flex;
flex-direction: row;
}
.content .left {
display: flex;
align-items: center;
justify-content: center;
flex-direction: column;
height: 80%;
width: 350px;
margin-left: 30px;
}
.content .left div {
flex-grow: 1;
height: 300px;
width: 380px;
padding: 5px;
}
.content .right {
display: flex;
align-items: center;
justify-content: center;
flex-direction: column;
height: 80%;
width: 350px;
}
.content .right div {
flex-grow: 1;
height: 300px;
width: 350px;
padding: 5px;
}
.content .center {
display: flex;
align-items: center;
justify-content: center;
flex-direction: column;
height: 80%;
width: 600px;
}
</style>
2.饼状图后端
myApp/utils/getScreenData.py
1
2
3
4
5
6
7
8
9
10
11
12
13
14
15
16
17
18
19
20
21
22
23
24
25
26
27
28
29
30
31
32
33from .getBaseData import *
def getSquareData():
goods = list(getAllGoods())
goodVolumn = {}
for i in goods:
if goodVolumn.get(i.address,-1): # 未获取到键,则赋值给销量
goodVolumn[i.address] = int(i.buy_len)
else:
goodVolumn[i.address] += int(i.buy_len)
goodsSortVolumn = sorted(goodVolumn.items(),key=lambda x:x[1],reverse=True) # 对销量排序
cityList = []
volumnList = []
for i in goodsSortVolumn:
cityList.append(i[0])
volumnList.append(i[1])
return cityList[:7],volumnList[:7]
def getPieData():
goods = list(getAllGoods())
goodsNumber = {}
for i in goods:
if goodsNumber.get(i.type,-1) == -1:
goodsNumber[i.type] = 1
else:
goodsNumber[i.type] += 1
pieList = []
for k,v in goodsNumber.items():
pieList.append({
'name': k,
'value': v
})
return pieListmyApp/views.py
1
2
3
4
5
6
7
8
9
10
11
12
13
14
15from django.shortcuts import render
from django.http import JsonResponse
from .utils import getScreenData
# Create your views here.
def screenData(request):
if request.method == "GET":
cityList,volumnList = getScreenData.getSquareData()
pieList = getScreenData.getPieData()
return JsonResponse({
'cityList' : cityList,
'volumnList' : volumnList,
'pieList' : pieList
})
3.前后端关联
Home.vue的全部代码:
1 | <template> |
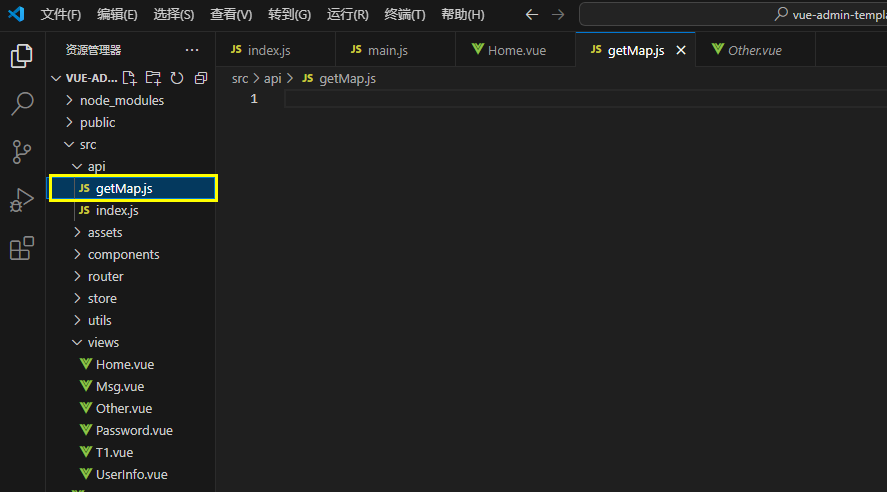
3.地图的配置
1.地图api配置
src/api下创建一个getMap.js文件
设置api,输入:
1
2
3import axios from 'axios'
export default axios.get('https://geo.datav.aliyun.com/areas_v3/bound/100000_full.json')
2.地图后端
myApp/utils/getScreenData.py
1
2
3
4
5
6
7
8
9
10
11
12
13
14
15
16
17
18
19
20
21
22
23
24
25
26
27
28
29
30
31
32
33
34
35
36
37
38
39
40
41
42
43
44
45
46
47
48
49from .getBaseData import *
def getSquareData():
goods = list(getAllGoods())
goodVolumn = {}
for i in goods:
if goodVolumn.get(i.address,-1): # 未获取到键,则赋值给销量
goodVolumn[i.address] = int(i.buy_len)
else:
goodVolumn[i.address] += int(i.buy_len)
goodsSortVolumn = sorted(goodVolumn.items(),key=lambda x:x[1],reverse=True) # 对销量排序
cityList = []
volumnList = []
for i in goodsSortVolumn:
cityList.append(i[0])
volumnList.append(i[1])
return cityList[:7],volumnList[:7]
def getPieData():
goods = list(getAllGoods())
goodsNumber = {}
for i in goods:
if goodsNumber.get(i.type,-1) == -1:
goodsNumber[i.type] = 1
else:
goodsNumber[i.type] += 1
pieList = []
for k,v in goodsNumber.items():
pieList.append({
'name': k,
'value': v
})
return pieList
def getMapData():
goods = list(getAllGoods())
cityVolume = {}
for i in goods:
if cityVolume.get(i.address,-1) == -1:
cityVolume[i.address] = 1
else:
cityVolume[i.address] += 1
mapData = []
for k,v in cityVolume.items():
mapData.append({
'name': k,
'value': v
})
return mapDatamyApp/views.py
1
2
3
4
5
6
7
8
9
10
11
12
13
14
15
16
17from django.shortcuts import render
from django.http import JsonResponse
from .utils import getScreenData
# Create your views here.
def screenData(request):
if request.method == "GET":
cityList,volumnList = getScreenData.getSquareData()
pieList = getScreenData.getPieData()
mapData = getScreenData.getMapData()
return JsonResponse({
'cityList': cityList,
'volumnList': volumnList,
'pieList': pieList,
'mapData': mapData
})
3.前后端关联
1 | <template> |
4.折线图
1.折线图后端
myApp/utils/getScreenData.py
1
2
3
4
5
6
7
8
9
10
11
12
13
14
15
16
17
18
19
20
21
22
23
24
25
26
27
28
29
30
31
32
33
34
35
36
37
38
39
40
41
42
43
44
45
46
47
48
49
50
51
52
53
54
55
56
57
58
59
60
61
62
63
64
65
66
67
68from .getBaseData import *
def getSquareData():
goods = list(getAllGoods())
goodVolumn = {}
for i in goods:
if goodVolumn.get(i.address,-1): # 未获取到键,则赋值给销量
goodVolumn[i.address] = int(i.buy_len)
else:
goodVolumn[i.address] += int(i.buy_len)
goodsSortVolumn = sorted(goodVolumn.items(),key=lambda x:x[1],reverse=True) # 对销量排序
cityList = []
volumnList = []
for i in goodsSortVolumn:
cityList.append(i[0])
volumnList.append(i[1])
return cityList[:7],volumnList[:7]
def getPieData():
goods = list(getAllGoods())
goodsNumber = {}
for i in goods:
if goodsNumber.get(i.type,-1) == -1:
goodsNumber[i.type] = 1
else:
goodsNumber[i.type] += 1
pieList = []
for k,v in goodsNumber.items():
pieList.append({
'name': k,
'value': v
})
return pieList
def getMapData():
goods = list(getAllGoods())
cityVolume = {}
for i in goods:
if cityVolume.get(i.address,-1) == -1:
cityVolume[i.address] = 1
else:
cityVolume[i.address] += 1
mapData = []
for k,v in cityVolume.items():
mapData.append({
'name': k,
'value': v
})
return mapData
def getLineData():
goods = list(getAllGoods())
priceDict = {'0-100': 0, '100-200': 0, '200-500': 0, '500-1000': 0, '千元以上': 0}
for i in goods:
p = float(i.price)
if p < 100:
priceDict['0-100'] += 1
elif p >= 100 and p < 200:
priceDict['100-200'] += 1
elif p >= 200 and p < 500:
priceDict['200-500'] += 1
elif p >= 500 and p < 1000:
priceDict['500-1000'] += 1
else:
priceDict['千元以上'] += 1
LineRowData = list(priceDict.keys())
LineColData = list(priceDict.values())
return LineRowData,LineColDatamyApp/views.py
1
2
3
4
5
6
7
8
9
10
11
12
13
14
15
16
17
18
19
20from django.shortcuts import render
from django.http import JsonResponse
from .utils import getScreenData
# Create your views here.
def screenData(request):
if request.method == "GET":
cityList,volumnList = getScreenData.getSquareData()
pieList = getScreenData.getPieData()
mapData = getScreenData.getMapData()
LineRowData,LineColData = getScreenData.getLineData()
return JsonResponse({
'cityList': cityList,
'volumnList': volumnList,
'pieList': pieList,
'mapData': mapData,
'LineRowData': LineRowData,
'LineColData': LineColData
})
2.前后端关联
Home.vue的全部代码:
1 | <template> |
5.动态环图
1.动态环图后端
myApp/utils/getScreenData.py
1
2
3
4
5
6
7
8
9
10
11
12
13
14
15
16
17
18
19
20
21
22
23
24
25
26
27
28
29
30
31
32
33
34
35
36
37
38
39
40
41
42
43
44
45
46
47
48
49
50
51
52
53
54
55
56
57
58
59
60
61
62
63
64
65
66
67
68
69
70
71
72
73
74
75
76
77
78
79
80
81
82
83
84
85
86
87
88
89
90from .getBaseData import *
def getSquareData():
goods = list(getAllGoods())
goodVolumn = {}
for i in goods:
if goodVolumn.get(i.address,-1): # 未获取到键,则赋值给销量
goodVolumn[i.address] = int(i.buy_len)
else:
goodVolumn[i.address] += int(i.buy_len)
goodsSortVolumn = sorted(goodVolumn.items(),key=lambda x:x[1],reverse=True) # 对销量排序
cityList = []
volumnList = []
for i in goodsSortVolumn:
cityList.append(i[0])
volumnList.append(i[1])
return cityList[:7],volumnList[:7]
def getPieData():
goods = list(getAllGoods())
goodsNumber = {}
for i in goods:
if goodsNumber.get(i.type,-1) == -1:
goodsNumber[i.type] = 1
else:
goodsNumber[i.type] += 1
pieList = []
for k,v in goodsNumber.items():
pieList.append({
'name': k,
'value': v
})
return pieList
def getMapData():
goods = list(getAllGoods())
cityVolume = {}
for i in goods:
if cityVolume.get(i.address,-1) == -1:
cityVolume[i.address] = 1
else:
cityVolume[i.address] += 1
mapData = []
for k,v in cityVolume.items():
mapData.append({
'name': k,
'value': v
})
return mapData
def getLineData():
goods = list(getAllGoods())
priceDict = {'0-100': 0, '100-200': 0, '200-500': 0, '500-1000': 0, '千元以上': 0}
for i in goods:
p = float(i.price)
if p < 100:
priceDict['0-100'] += 1
elif p >= 100 and p < 200:
priceDict['100-200'] += 1
elif p >= 200 and p < 500:
priceDict['200-500'] += 1
elif p >= 500 and p < 1000:
priceDict['500-1000'] += 1
else:
priceDict['千元以上'] += 1
LineRowData = list(priceDict.keys())
LineColData = list(priceDict.values())
return LineRowData,LineColData
def getCircleData():
goods = list(getAllGoods())
sumDict = {}
sumPice = 0
for i in goods:
p = float(i.price)
sumPice += p
if sumDict.get(i.type,-1) == -1:
sumDict[i.type] = p
else:
sumDict[i.type] += p
for key in sumDict:
sumDict[key] = round(sumDict[key] / sumPice * 100, 0)
circlieList = []
for k,v in sumDict.items():
circlieList.append({
'name': k,
"value": v
})
return circlieListmyApp/views.py
1
2
3
4
5
6
7
8
9
10
11
12
13
14
15
16
17
18
19
20
21
22
23
24
25
26
27
28
29
30
31
32
33
34
35
36
37
38
39
40
41
42
43
44
45
46
47
48
49
50
51
52
53
54
55
56
57
58
59
60
61
62
63
64
65
66
67
68
69
70
71
72
73
74
75
76
77
78
79
80
81
82
83
84
85
86
87
88
89
90from .getBaseData import *
def getSquareData():
goods = list(getAllGoods())
goodVolumn = {}
for i in goods:
if goodVolumn.get(i.address,-1): # 未获取到键,则赋值给销量
goodVolumn[i.address] = int(i.buy_len)
else:
goodVolumn[i.address] += int(i.buy_len)
goodsSortVolumn = sorted(goodVolumn.items(),key=lambda x:x[1],reverse=True) # 对销量排序
cityList = []
volumnList = []
for i in goodsSortVolumn:
cityList.append(i[0])
volumnList.append(i[1])
return cityList[:7],volumnList[:7]
def getPieData():
goods = list(getAllGoods())
goodsNumber = {}
for i in goods:
if goodsNumber.get(i.type,-1) == -1:
goodsNumber[i.type] = 1
else:
goodsNumber[i.type] += 1
pieList = []
for k,v in goodsNumber.items():
pieList.append({
'name': k,
'value': v
})
return pieList
def getMapData():
goods = list(getAllGoods())
cityVolume = {}
for i in goods:
if cityVolume.get(i.address,-1) == -1:
cityVolume[i.address] = 1
else:
cityVolume[i.address] += 1
mapData = []
for k,v in cityVolume.items():
mapData.append({
'name': k,
'value': v
})
return mapData
def getLineData():
goods = list(getAllGoods())
priceDict = {'0-100': 0, '100-200': 0, '200-500': 0, '500-1000': 0, '千元以上': 0}
for i in goods:
p = float(i.price)
if p < 100:
priceDict['0-100'] += 1
elif p >= 100 and p < 200:
priceDict['100-200'] += 1
elif p >= 200 and p < 500:
priceDict['200-500'] += 1
elif p >= 500 and p < 1000:
priceDict['500-1000'] += 1
else:
priceDict['千元以上'] += 1
LineRowData = list(priceDict.keys())
LineColData = list(priceDict.values())
return LineRowData,LineColData
def getCircleData():
goods = list(getAllGoods())
sumDict = {}
sumPice = 0
for i in goods:
p = float(i.price)
sumPice += p
if sumDict.get(i.type,-1) == -1:
sumDict[i.type] = p
else:
sumDict[i.type] += p
for key in sumDict:
sumDict[key] = round(sumDict[key] / sumPice * 100, 0)
circlieList = []
for k,v in sumDict.items():
circlieList.append({
'name': k,
"value": v
})
return circlieList
2.前后端关联
Home.vue的全部代码:
1 | <template> |